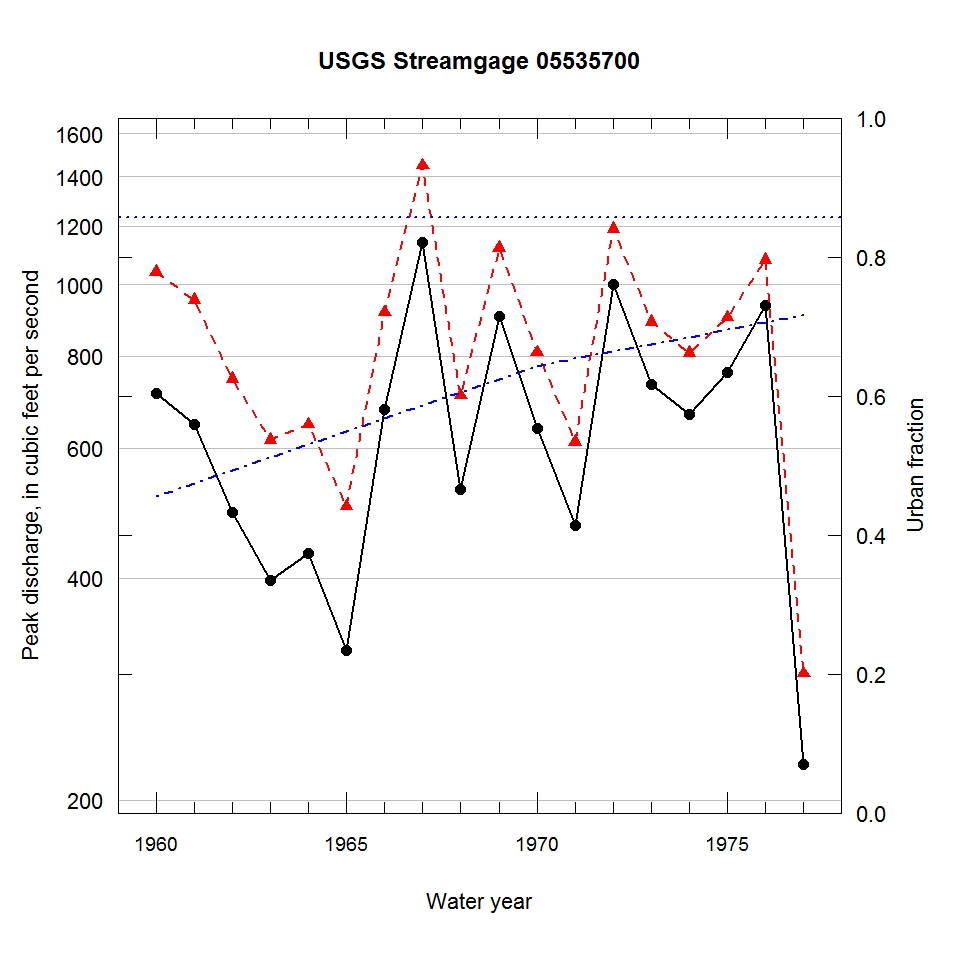
Observed and urbanization-adjusted annual maximum peak discharge and associated urban fraction and precipitation values at USGS streamgage:
05535700 WF OF NB CHICAGO RIVER AT GLENVIEW, IL


| Water year | Segment | Discharge code | Cumulative reservoir storage (acre-feet) | Urban fraction | Precipitation (inches) | Observed peak discharge (ft3/s) | Adjusted peak discharge (ft3/s) | Exceedance probability |
| 1960 | 1 | -- | 0 | 0.455 | 0.330 | 713 | 1040 | 0.227 |
| 1961 | 1 | -- | 0 | 0.474 | 1.571 | 647 | 952 | 0.309 |
| 1962 | 1 | -- | 0 | 0.493 | 0.222 | 491 | 744 | 0.557 |
| 1963 | 1 | -- | 0 | 0.511 | 0.944 | 397 | 616 | 0.730 |
| 1964 | 1 | -- | 0 | 0.530 | 2.137 | 432 | 646 | 0.691 |
| 1965 | 1 | -- | 0 | 0.549 | 0.384 | 319 | 500 | 0.862 |
| 1966 | 1 | -- | 0 | 0.568 | 1.506 | 678 | 916 | 0.351 |
| 1967 | 1 | -- | 0 | 0.587 | 1.933 | 1140 | 1450 | 0.075 |
| 1968 | 1 | -- | 0 | 0.606 | 1.693 | 527 | 707 | 0.606 |
| 1969 | 1 | -- | 0 | 0.624 | 1.303 | 905 | 1120 | 0.184 |
| 1970 | 1 | -- | 0 | 0.643 | 1.298 | 638 | 809 | 0.478 |
| 1971 | 1 | -- | 0 | 0.654 | 0.418 | 472 | 612 | 0.735 |
| 1972 | 1 | -- | 0 | 0.664 | 2.114 | 1000 | 1190 | 0.155 |
| 1973 | 1 | -- | 0 | 0.674 | 0.712 | 733 | 890 | 0.383 |
| 1974 | 1 | -- | 0 | 0.685 | 0.564 | 666 | 807 | 0.482 |
| 1975 | 1 | -- | 0 | 0.695 | 1.161 | 761 | 902 | 0.368 |
| 1976 | 1 | -- | 0 | 0.706 | 1.411 | 937 | 1080 | 0.205 |
| 1977 | 1 | -- | 0 | 0.716 | 1.169 | 224 | 297 | 0.978 |

